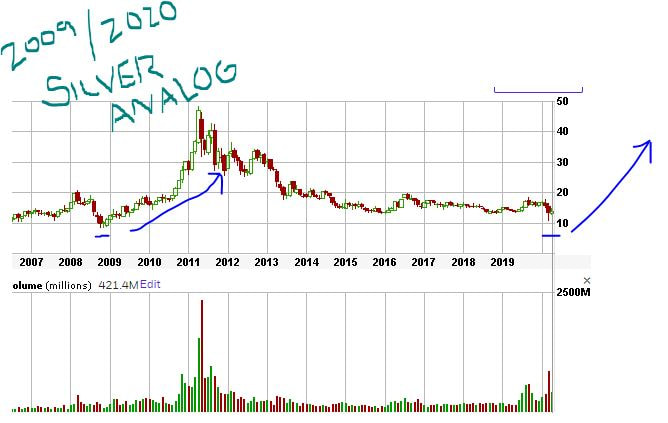
Obviously the last time we had an economic shock/deflationary scare and then massive money printing was 2009. Silver tanked during the initial sell everything phase and then started rebounding during the "Great Reflation" until going parabolic and exploding into a supernova chart. I'm not much of a gold/silver bug but I am looking at this analog and will start setting up some longer term trades on the SLV through call spreads that go out 6 months to 1 year. Today we have Bitcoin as an alternative for "sound money" and millennials may purchase that instead of silver to a degree so that's a negative. Also industrial uses are currently taking a hit, but I suspect as part of any economic stimulus and infrastructure spending silver uses will pick up. Much silver mining production is now on hold due to the virus lock downs (more so than other metals) so that helps prices in the short term. Silver is one of those "investments" that has burned a great many people over a long period of time, with only a couple huge upside moves in between. I'm really only expecting another one of those moves for the next year or two and then more than likely silver will go back to being forgotten and tarnished.
I am now viewing the market as a old fashioned scale or maybe (more appropriately) the red corner and the blue corner in a championship boxing ring. On the one side we now have the Fed with a printing press and (possibly) a mandate to do whatever it takes to keep the stock market up by expanding their balance sheet to the tune of many more trillions. It did not shock me much that they went into the corporate bond market by buying up investment grade bonds, buying the LQD fund, etc. But now that they are buying up junk bonds it pretty much guarantees that they are gonna create the zombie company scenario, causing slow to no growth for years to come, not to mention the moral hazard and non punishment for the many years prior of mal-investment (Isn't crony capitalism is great?). On the other side of the scale we have reality: 30% reduction in GDP because of a shuttered economy resulting in trillions of dollars in real losses. Mom and pop raiding their 401Ks to pay the bills (and not adding anymore for awhile as the company they work for says no more matches for the time being). True this will not last forever and more and more of the economy will re-open. But it will take a long while no doubt and human behavior will certainly be altered from where it was 2 months ago.
So our stock and economy bubble was pricked at the end of February 2020. After this we have a new normal (a newer and crazier normal than Mohamed El-Arian's 2008) and may take a year or two to transition back to a place that more closely resembles that of pre-February. So during this new normal period do we have the typical 22 month bear market? Or do we throw all previous history out the window because we have the Fed pressing their enormous thumb on the above mentioned scale? Of course the gold bugs will say to buy metals because the Fed is gonna create hyperinflation due to the money printing. But I'm thinking that only the Helicopter Money (cash money to the masses in excess of what they earn at a job) actually causes inflation and the debt bailouts that create zombie companies actually creates deflation (why stop drilling for oil or building the widgets - which causes pressure on prices - when you have a free pass to keep operating in a non-rational manner?) So we will have another inflation/deflation battle going on. Of course if the psychology of the masses creates a gold/silver buying frenzy like from 2009 to 2011 then of course that would be a good trade again. But what about other hard assets that one would expect to do well with inflation like land/housing, etc? Well currently most landlords are shaking in their boots because they are not getting paid and laws are being enacted so that they can't do anything about it (120 day eviction moratoriums). Also this will be a perfect time for counties and municipalities to increase taxation beyond anything we can comprehend (they will tell us they have to pay the bills you know!). So increased property and sales taxes at the worst possible time? I'm assuming it will be more sales tax increases than property tax but both will increase. But real property will probably still be a good investment compared to other sectors, especially if some foreclosures start hitting the market (when they are legally allowed to) and that is your base price entry. More housing units will certainly be needed after the Covid passes and the number of babies being born from couples being holed up together will create the need for bigger places in a couple years; and the flip-side, all the divorces caused by the same thing will force those separated into their own housing units (so either way more houses needed). Also back in the stock market there will be the shares of the companies that do well in the new normal and those that do worse. So stock picking will be of benefit again and I will need to really go through my micro-cap watch list and highlight the ones that may be OK and wait for those that the cycle hits hard and discard the others that are no bueno (not that I had any cruise ships on my list but I'm sure there are a couple just as bad). So I guess the key here is that whatever the scale above does we can find ways to make our investments pay or wait for opportunities to appear: Hard asset plays (trade and invest in what appears in front of us) and stock picking for the new normal of post Feb 2020. I guess I will have to get to work cleaning up my stock watch list. So much has changed since my last post just over a month ago, when I was pulling my hair out because the markets kept hitting all time highs in spite of a massive threat (which incidentally I had the exact same feeling in 2007 when I was noticing the hundreds of thousands of foreclosure notices hitting the county clerks' offices while markets continued to hold up). At any rate I'm not going to talk much about everything that has gone on, which pretty much everyone on the planet is aware now, but I will have to say the scope and economic damage is way beyond even what I was thinking (and I can be pretty pessimistic at times). But alas the FED is doing what I thought they would (printing and buying anything that moves) plus a 1000 percent! So when the dust starts to settle and hopefully the virus begins to fade, the only game in town is to go long stocks and hard assets. Holding too much cash in a portfolio will be too risky a proposition in the face of possible inflation. Inflation is the only way out at this point. The only question is when. This has been one of the quickest and most precipitous drops in history and it is possible that the recovery could be just as swift. I believe the only thing that matters at present is watching for any sign of slowdown of the spread of the virus and whether or not we can see a return to a semblance of normalcy. That point should be a great buying opportunity (barring any second and third waves of the pandemic where we will need to have further shutdowns and quarantines and therefore further financial disruptions). Keeping everyone safe should be the number one priority. The economy will come back.
As an add-on to the post below that describes the correlation between the 1999/2000 stock bubble and today's market, I am noticing another similarity: micro cap value vs growth (or pie in the sky I like to call it) is again out of sync. Back in the day it was "Brick and Mortar" vs "Dot.com" or more precisely, something that had profitable earnings vs the pie in the sky hopes of one day having earnings, with brick and mortar stocks dropping every day while the growth hype hitting extreme insanity. Same today... I just looked at a list of value micro caps I follow and today while the Dow/Nasdaq/SPY are all up insane amounts (1% on Naz) almost 80% of the value micro cap stocks are actually down on the day. Again, just a little bit anecdotal but strange to say the least. Perhaps the $0 commissions have mom and pop selling anything boring to free up some cash to get the shiny new TSLA stock at $950! Momentum does beget momentum in both directions (up and down) and where it stops... nobody knows. But must be getting close. Another similarity is energy... oil and nat gas stocks are crushed just as they were in 1999/2000 (but I suppose I am already putting these stocks in the "value" bucket)
I like looking back at the charts to see repeat patterns. This one below was pretty easy to see. In the late 90's when the Nasdaq was going hog-wild a few things happened to cause a hiccup and pullback - the Asian Crisis and the Russian Default - both of which killed Long Term Capital Management LTCM, which forced a bailout by the big banks (the Fed) and arrested the fall in the stock market exactly at the end of Sept 1998. The Fed of course cut rates too to help fuel the further exuberance. More recently, in our current hog-wild Nasdaq parabola (Tesla to $1,000 Robinhood traders!) we had the little 2018/2019 hiccup caused by the supposed tariff/trade fears, that of course the Fed came in to fix (mid cycle adjustment says Powell - like in 1998) and then the further (not QE) Repo balance sheet explosion. At any rate, now with the world's largest economy shuttered due to a zombie apocalypse virus in China, for some reason (mega central bank intervention) we have the market in the parabola continuation pattern. So I just thought I would look at the time interval from the Sept 1998 pullback to the ultimate Feb/March 2000 peak in the QQQs and extrapolate that to our current chart. So if history repeats and we keep our patterns nicely consistent, this current melt-up could last until April/May 2020? With many corporations around the world now saying they are gonna have a little bit of a problem getting supplies and may not be able to ship and cruise lines - airlines - freight lines - not budging, I have a hard time seeing that. Somewhere on the internet I saw a darkly comedic meme which stated something like: The year is 2023 and all humankind is wiped out. The unmanned computers at the Federal Reserve are continuing to bid up the Dow Industrial Avg to all time highs. Makes sense...
While I sometimes attempt to trade a possible winter bounce in Natural Gas, I have noted in previous years that the actual best time to go long Natty is during the month of February. Probably this is about the point in time when traders stop worrying about how cold or warm winter is going to be (or if we are even going to have winter in the east coast like this year) and move on to other things. The last time Nat Gas got this ugly from a long bias trading perspective was 2016 and the bottom didn't hit until late February of that year. The bottoms have been moving earlier during the month since that time. Here is the chart below. Currently long with small position but look to add during February. From a fundamental perspective it seems production has finally been dropping the past month or so from record levels and LNG exports are cranking up. Aside from that it's pretty ugly. But a one month bounce or so is all I'm looking for anyway.
Research has been done over the years which has shown small and microcap value stocks outperform the general market. When filtering out the poorest of the bunch and factoring for value/growth/momentum the outperformance is much greater (A report from OSAM.com shows quality adjusted microcap stocks returned 14.2% annual from 1982 to 2016). With this in mind I decided recently that a perfect portfolio would consist of about 20 to 25 microcap stocks in varying industries, where quality counts, and other metrics like liquidity or analyst coverage has no bearing on whether or not a stock is included (I mention these last two things because most portfolio managers would cringe at low volume/illiquid shares or companies with no analyst coverage whatsoever - and this is precisely the edge). While I have been researching loads of stocks to include in the portfolio I have been thinking about the dynamics of gathering positions and market/cycle timing. Microcaps are even more cyclical than the general market so thinking about where we are in the economic cycle will play heavy on the performance of the portfolio and the timing of share purchases. I am assuming we are very late in this economic cycle and barring any more rabbits pulled from the Fed’s hat or more sugar rush kicks (like the enormous tax cut package) which I basically consider can-kicking to extend the cycle, I believe that a good amount of cash should be deployed only when a recession is fairly evident and a bear market is observed. So with that said (and knowing how difficult market and cycle timing can be) I will most likely build positions over a very long time frame, such as the next 2 to 3 years, meaning the first batch of purchases of the 20 to 25 identified positions should amount to only about 15% of total cash outlay and the rest of the portfolio’s capital deployed slowly but opportunistically using deep low-ball good-til-cancel orders which would get filled on big market down days - or when an impatient investor decides to unload stock at any given time - which is precisely why I like illiquid/wide spread shares. Also, since this portfolio will most likely have a fixed amount of cash to start with little being added later to invest, dividends will play an important role in purchasing future shares. With that said, while probably only half the companies I have researched so far provide a dividend, those that do have an average yield of about 4% which will be reinvested. Also, while buy and hold will be the goal, there will be some churn which will also provide liquidity for future purchases (just like opportunistic purchases, opportunistic sales will happen during periods of volume and price spikes, etc). While there are no strict metrics for what is considered value in this portfolio, the average company will have no or little debt, lots of cash, P/E ratio (dependent of industry) but typically 15 to 25 with some growth. Small companies can be very lumpy with hit or miss quarters, so in the short term some patience is necessary, as long as longer term company or sector specific trends do not stray too far from the course. I will update more specifics soon.
My BRK.b short had to be closed out a little early a couple weeks ago, as Berkshire got to around $204 and the market didn't want to go much lower. I made a profit but not nearly the profit that was planned (same for the AMD spread). That's what a bullish market will do to you. Now the BRK.b chart channel is looking like it is getting close to resolving itself one way or another and looking more like the coiled spring triangle that I always dread. The reason I don't like the pattern is that there is about a 50/50 shot of which way it breaks and even when it does break half the time it ends up being a false break and then goes right back to the channel or right through it. So BRK is a no touch for me now.
In the previous post I mentioned what happens when a long-time channel gets broken. The result is quite often an explosion in the direction of the break. Advanced Micro had a nice tight channel pattern that one could have traded for about a year and a half. Slightly lower highs and slightly lower lows (although usually about the $10 level on the low end). At any rate, just when someone was gonna put on their short on at the upper range of the channel during the middle of 2018, the top of the channel was broken. The right move would have been to cut losses and cover the short and (crazy sometimes as it seems) go long. The stock more than doubled in just a few months. I noticed this past channel and break because I am currently short with a put spread looking for slightly lower into October expiration.
A nice and simple way to trade is to use a defined visual channel. It does not matter much what the symbol is or whether the subject is stock or commodity or bond. This particular chart has a slightly declining range (somewhat lower highs and lower lows). Shorting the tops and buying the drops has seemed to work quite well for the past year and a half or so. This is actually Warren Buffet's baby (BRK.B - Berkshire). My last trade on this was a vertical put spread from just above the 210 area with the expectation of 195 to 200 by expiration in Oct. The idea is to make about 4 times the original trade if successful and then take the other side from 195/200 area back to the 210 region a month or two later. I should point out though that when long channels break one way or another they generally explode out in whichever direction: so stops are good ideas. Also, of course, timing is everything - so trading options a couple months out from expiration could help with that variable.
|
Paul SaadSenior Manager, Paul Saad and Associates, LLC Archives
May 2020
Categories |