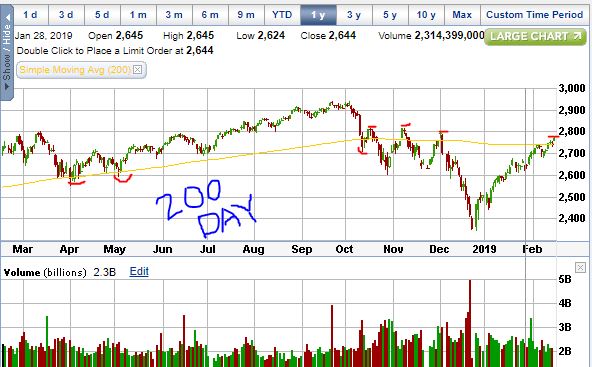
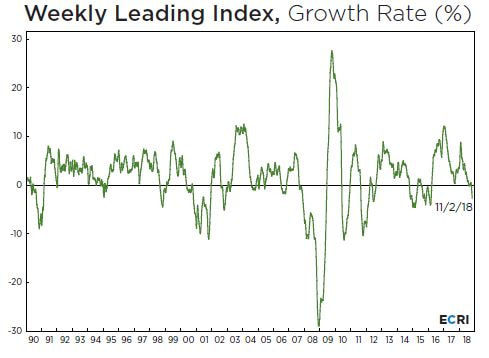
The market has been very bullish to say the least. Yesterday was one of the worst retail sales #'s posted since the Great Recession and all it took was Larry Kudlow to get on the TV and say it was probably just a glitch to get the S&P back on track. Today more China trade deal headlines and exploding higher. This time though we are around that 200 day moving average point again where previously rallies during 2018 stayed above (only 2 to 4 days) then stalled.Today will be the 4th day above the 200 day. Should the market maintain above here it could give the bulls even more confidence to buy (next good resistance is probably 2800 to 2820). A good rule of thumb for investors has been to stay long while the market is above the 200 day and stay out of the market when it is below it. I added to shorts yesterday and it does not feel too smart at the moment. I was calling this rally a dead cat bounce previously. That will still be true if we lose momentum here, otherwise the bull may be back on. From a fundamental perspective we are getting some late-cycle signals that are warnings. Housing - autos - heavy truck sales - slowing. Job #'s as good as it gets, etc. ECRI’s U.S. Weekly Leading Index (WLI) slipped to 143.6 as its growth rate ticked down to -4.3% and is now lower than any time since 2011 or so. So from a long term investment point of view one should be wary. From a trading perspective I believe the prospects of a China deal is keeping the market bull alive. Most likely we get a short lived pop with an actual deal then a sell-off. But keeping a close eye on the 200 day. If we stay above the line a few more days I would probably start taking some shorts off.
We got the massive bear market rally I was looking for off the lows (or at least I will assume this a bear market rally and not the start of something better at this time). I am completely out of all long positions now and looking to start shorting in spots. Some leading economic indicators are starting to stall and the index charts are looking pretty broken. About the best positive for the market is the fact that the Fed is starting to sound pretty dovish and could possibly be done raising rates during this cycle (still 2 rate increases at least forecast but most are doubting this). They are still running off the assets accumulated during QE and therefore we still have the QT going on and going forward - the E (easing) is now T (tightening). Also the yield curve is flatter and almost inverted and therefore the recession is just around the corner (historically speaking). My only concern (from a bearish perspective) is the fact that every little positive headline (China deal!!!) shoots the indexes higher but just the opposite headline (No deal in sight!!!) does little to no damage and therefore we are still in a bullish bias near term (at least currently). Time will tell
It has been a brutal December market, maybe the worst ever in modern times (down close to 10% now for the month). I was planning for a Santa rally and so far he is missing in action. But here is the interesting thing looking at past bear markets: Even during the worst of the worst bear markets there was normally a retracement rally that would take the market up 10 to 13%. So with the S&P now down about 15% from its peak (now around 2500) that type of rally would get us back to 2775 to 2800. Now that would certainly be a welcome selling opportunity for anyone long. The problem with timing such an event would be to assume that the 15% dive to 2500 is the near term bottom. There were a couple bear markets in the past where the retracement rally didn't start until the market was already down around 20% from the previous highs, so sticking one's neck out to purchase and anticipate such a rally could be painful for awhile. The average area for a retrace would be about the 15% we are down now.
The other point here is that maybe this is not a bear market at all and therefore any purchases would be very smart in hindsight. The leading economic indicators are flashing warnings only modestly... not quite the stuff of bear markets yet (although that could change quickly). At any rate, my personal strategy will be to sell everything I purchased here in December during late January and into February. So sort of a bear market bounce and January effect combo trade. We shall see. The Fed will most certainly raise another 1/4% in December but ECRI’s U.S. Weekly Leading Index (WLI) fell to 145.0, while WLI growth decreased to -2.6%. (Source ECRI) But could the Fed's dot plot for 2019 start to change? The market is now only expecting about 2 additional hikes next year. If economic #'s continue to slide we could be much closer to the Fed pause than we realize. I may buy short term treasuries through the etf SHY at that time. SHY should provide a stable investment and a slight yield (probably close to 3%) while the stuff hits the fan.
Disclosure: No position I like seasonal patterns. One of the most reliable lately has been that gold bottoms around middle of December each year (a couple times in November) and then finds some rally legs in January. Why this has happened is anyone's guess... Some say it's because all the holiday gold jewelry buying worldwide, or recent dollar seasonality, or demand in India for weddings and such, or even the tax loss scenario - since the yellow metal has been in decline and you get the tax loss then buying pop in January (which is another one of my favorite seasonal trades in small cap stocks). At any rate a good trading vehicle for this (short term) is UGLD - a 3X gold long.
Disclosure: No position currently We got the big bounce I was looking for after yesterday and I sold some prior day's purchases (SPY and XLE). In other news, BOFI - Bank of Internet is now AXOS financial AX (but I am having a hard time using the new ticker/name after 12 years of BOFI) and released earnings yesterday. The numbers were not the greatest and stock is getting knocked down. First Internet Bank (INBK) had similar #'s at 61 cents for the Q but INBK has already been knocked down to below tangible book value and (hopefully) has little room to fall further. INBK is more of a value story and AX has recently been the big growth story. Unfortunately for AX their tangible book is $14.59/share which is a steep drop from current quotes around $27/share. INBK is trading around $25.50 with a tangible book of $27.80. Of course AX will most likely get their growth story back on track and therefore deserves a higher valuation (also AX has a much better ROA and ROE than INBK), however I won't be buying AX until the bloodbath and recession we are due for is in full force (of course leading economic indicators state I will be waiting awhile for that to happen). Remember that the yield curve will probably invert some time after January 1st which means these banks will have a harder time with their margins. Also when the inevitable recession hits the loan loss reserves go way up, knocking earnings down to scraps (and possible negative #'s). So I feel safe trading (and possibly building positions) in INBK but not yet for AX.
Disclosure: Long INBK (may buy more or sell at anytime) The market is crashing again and I am buying again. First Internet Bank - INBK reported a decent Q after hours today showing 61 cents for the quarter and most importantly (to me anyway) is that tangible book value is now up to $27.80/share. The last print today was $24.38 so the discount is fairly obvious. I did some INBK buying during market hours and expect to add more tomorrow. I also could not help myself and bought some energy names and some SPY. The markets are getting pretty ugly at this point and I'm looking for a bounce. On the economic and earnings front things are still looking pretty darn good. Housing is a weak spot but historically that sector is a very far leading economic indicator (like it can fall one to two years before bear markets/recessions begin). However, I do have to remind myself to trade very small (I'm currently 80% cash) as there is still a slim chance that I'm picking up pennies in front of the proverbial steam roller here.
Well the markets have been pretty much crashing the last couple days and there is palpable fear now. The CNN Fear and Greed index is down to about 5 today (the lowest I have ever seen it) and therefore I have to do some buying. I don't want to and it goes against every fiber in my soul but I still believe (according to leading economic indicators) this bull market is not dead yet. So I will get long a little here while everyone else seems to be selling.
The S&P is down a couple percent since I last said it may be safe for a short trade for the first time in awhile. Some are saying it's all about the long end of the bond market finally selling off causing yields to rise. The 10 year broke through to as high as 3.24%. The yield curve is actually wider at this point which subsequently takes us farther from a "recession is imminent" signal and we remain "economy is booming" or in other words "forget about a bear market"! The Nasdaq and small cap Russell did get hit hard here and may fall a couple more percent in the next week or two, but I am actually more fearful of a rip-your-face-off rebound now. Basically I'm a once bit, twice shy short seller, with his tail between his legs - but it's still just the first week of spooky October and anything can happen at this point. Fundamentally, the market is generally obscenely overvalued on many metrics and could snap like a twig. Also, the elections are just a month away now so we may see more profit taking on the lead up. But looking out a little further I can't imagine not having the seasonal last quarter rally, especially when all the indicators are showing systemic ebullience, like consumer confidence at all time highs and job market "best ever!". Of course those things could also be the "as good as it gets" signal so 6 months from now we may sing a different tune.
On a side note - Bank of Internet (BOFI) is now Axos Financial (AX). I don't currently own it but it's on my wish list for when the stuff hits the fan, someday in the (hopefully) not too distant future. I will put together my full wish list/watch list sometime here (for longer term stock investments). The Fed raised rates as expected yesterday and I heard from quite a few sources that rates may be higher but they are still historically low. Well that may be true in absolute terms but does anyone notice the trend on the chart? In previous cycles the Fed would raise then pause then start cutting when they overshot (with recession evident). This begs a couple questions, the first being how high is too high relative to past increases and second how low is the next low base as 0% is most likely not going to be the line in the sand. Negative rates will most certainly be in the bag.
|
Paul SaadSenior Manager, Paul Saad and Associates, LLC Archives
May 2020
Categories |