Disclosure: starting to short S&P
When the market was falling apart in Jan/Feb of this year we sided with some technical analysts and decided that those all-time highs would need to be re-tested before a down leg could begin in earnest. Well the S&P and Nasdaq did their part and extended beyond and now the Dow has retested and is at all-time highs again. 
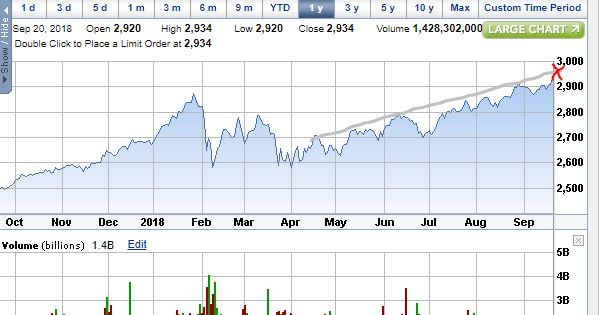
So we are approaching the levels of the crudely drawn upper trend line on the S&P (probably between 2930 and 2960) and this could be a good point to start putting on some shorts. Seasonality is at play here going into the spooky month of October and we are heading into earnings buy-back-black-out period (the first week of October about 85% of companies will be prevented from buying their stock) so it may be safe for some bears to start romping for a trade. However we are not getting the "recession is imminent" signal yet so the longer term bear trade is still up in the air. I guess we will play it by ear (and watch the leading economic indicators).
Disclosure: starting to short S&P One of my favorite long time investments, since 2007, has been Bank of Internet - BOFI - as originally it was cheaper than dirt (based on book value - P/E ratio - growth) but even today on a relative basis seems investible (but I don't own it). As most people know banks pay out interest according to short term rates and lend according to long term rates (borrow short and lend long). Their profit is the spread between the two or what is known as the Net Interest Margin - NIM. With the Fed raising short term rates, and long term rates stubbornly holding low, the yield curve is very narrow and will most likely flatten more come September and perhaps invert after the following Fed raise. This means two things - all banks have a hard time growing earnings and a recession is on the horizon (based on much historical evidence). These headwinds make it very hard to invest in any stock at present and double so for banks. Here is where having patience could pay off. Sure the market and some stocks like BOFI may continue slightly higher but the buying opportunities that will arise in a year or so should be much more rewarding. Of course long term investors could still purchase a little here and a little there and with dollar cost averaging muddle through the hard times to come. However I will bide my time, stay mostly in cash (or divert cash to other non stock market investments) and hope when the next recession (and bear market) hits the Fed will have all those tricks investors have come to expect ready to roll out (bond purchases - negative interest rates - outright stock purchases). And most importantly, when the stuff is hitting the fans, we investors have the wherewithal and intestinal fortitude to follow through and buy all those stocks during the bloodbath (because it is very difficult even for the most seasoned investors to buy greedily when the panic sets in). Disclosure: No position in any stock mentioned Through December and January the market was on a relentless rip higher and lesser quality assets appeared to bubble (cryptocurrency - etc). It appeared to be the blow-off top we had been waiting on. Since then we have had a small market correction with much increased volatility which has now lasted a few months. With the Trump tax cut package implemented corporate earnings would certainly be great for the next 6 to 12 months on comp basis. I am viewing the tax cuts as the final can kicking (this expansion has been fueled by a number of can kicking maneuvers, started by the massive stimulus package with debt and giveaways - then insane money printing and daisy chain bond and asset purchases by all central banks - finally a tax cut package that also creates trillion dollar deficits). The question is how long do we get the economic benefits from the tax cuts and when does the sugar high run off? If corporations make real investment (not just one time bonuses and stock buybacks) then it is quite possible this latest can being kicked down the road could roll a little further than I expect. Leading economic indicators of all types are still showing nice expansion which basically says there is no way (other than black swan stuff) do we get a recession in the next 6 months. But I am certainly feeling like I am picking up pennies in front of a steam roller when I think about buying some things here during this correction. From a technical perspective many of the chart guys are saying the top has to be retested (or a near miss) as a rally of this length and magnitude doesn't just end with a shrug. So I guess the answer at the present time is to keep trading with a flat bias (buy the dips - short the rips) until both fundamental and technical patterns say to "stay in cash or stay short".
I have attempted to short the S&P in spots lately - usually when the chart of the index gets extended and I am looking for a mean reversion type trade - but I have gotten stopped out for the most part because the action has been relentless (up). So valuations are obviously extreme (probably the only time more so was the 1999-2000 tech bubble which now appears to be the measure of all things) and only technical analysis can be applied at this point. But the chart guys for the most part just keep re-drawing their channels and levels and scratching their heads. The CNN Fear and Greed index and has been off the charts (I usually short at the spikes on the indicator and buy at the bottom levels). Chart below: So at this point a short-biased trader will need to stay small in size or maybe get destroyed by a relentless parabolic (blow-off) top. I am assuming other bears threw in the towel a few months ago and started playing the long action. It makes sense, as I recall making a killing on the long side during the dot-com days, but also suffering the losses when thinking those first big dips would be bought. This melt-up in the tape has been strange (low volatility - low volume) with very little emotion, unlike anything probably anyone has ever seen. Maybe because it's all algorithm driven - central bank bought - funny printed money - coming in from the ether - fantasy stuff. But anecdotally it appears some of the moms and pops are finally coming into the casino, along with the bears throwing in their proverbial towels, so this could finally be the blow-off top some were waiting for. The "Trump Trade" tax-cut package is ostensibly the carrot in front of the stick on this latest move. But fundamentally most DOW components already deal with a very low tax rate with all the financial engineering that goes on, so I am not sure how much a lower corp tax rate would help and the DOW components that would be helped the most have already increased 50% to 80% since the election (I mention the DOW because it was easier to evaluate 30 corporate tax rates than 500 in the S&P). Lucky for me I was in bitcoin and ethereum currencies until a few months back. Of course I liquidated early and missed the parabolic moves they are experiencing now (but made a great profit nonetheless). Also real estate has been red-hot so that has helped. But I mention these things because what is not red-hot at this point? Hence the everything bubble! Only commodities have been lagging (much like in 1999) but I believe this also has something to do with easy money flying around the globe. As long as oil explorers and farmers and miners are getting easy money they will continue to drill and grow and dig. So prices continue to fall. At any rate, this market is almost impossible to short at this point. It could flash crash tomorrow or zoom another 10% higher in a month. I will take a step back and short small only in spots. Can you guess the chart below? No it's not Bitcoin it's actually the DOW. That ramp we are seeing now has some of the best velocity we have ever seen. The past two fed calendar meetings (July 25-26 and Sept 19-20) have resulted in little action on the "Fed Drift" trade (if you buy the S&P on the stock market open on the day prior to a Fed meeting, and sell about 15 minutes prior to the announcement at 2:15 the following day). Perhaps this is simply because - as has been noted before - once a strategy is identified it no longer works. I have noticed that the market has tended to sell-off following the last few meetings. Perhaps this is a new trend or just an anomaly. As far as the meeting went, Yellen announced that they will begin running off about $10 Billion a month of holdings to shrink the balance sheet, as expected, and the dot plot for increasing rates was a little more hawkish than expected. The fact is that if the Fed buying up securities caused the stock market to rise, then logically one would think that selling off (or allowing the balance sheet to shrink) would have the opposite reaction. I am reluctantly short the S&P here around 2,500. We shall see. At any rate we are long overdue for a correction of any kind.
(This post originally appeared 9/19/2015)
So if I told you that you could have a market beating return by just being fully invested for 8 days out of the year and in cash the remaining 357 days, would that seem crazy? Well according to research created by the NY Fed, you can do just that: http://www.newyorkfed.org/research/staff_reports/sr512.pdf According to the research, which primarily looks at data from 1994 to near present, if you buy the S&P on the stock market open on the day prior to a Fed meeting, and sell about 15 minutes prior to the announcement at 2:15 the following day, you can have an average daily return of about .5%. Interestingly, if you remove the historical performance of these 8 days from each year going back to 1994, investing in the stock market wouldn't be so hot. I suppose the best strategy here would be to buy call options on the SPY or perhaps use a leveraged 3X fund (like SPXL) as the trading vehicle on those 8 instances. My biggest concern with this strategy is the simple fact that the cat has been let out of the bag and generally strategies fail as soon as they are identified. The research report was dated 2011. There was not much difference between periods of tightening or easing. In the chart below, the solid line is the market performance on Fed days and the dotted line is the average return on non-Fed days. Many investors (especially those just starting out) want to delve into the world of micro-cap stocks, mainly because of the tremendous potential for gain which stocks trading at or below $1 can deliver. Unfortunately many investors get most of their stock training by visiting web sites which specialize in nefarious practices under the guise of "expert opinion". The most important thing to understand about stock investing, and micro-cap investing in particular, is that you should trust no one. Do not trust company officials, investor relations representatives, web site operators, message board bloggers, stock gurus, grandma Miller, uncle John, or cousin Fred. Always find the facts for yourself. Never take anything for granted. Most web sites which profile micro-cap stocks are bought and paid for promoters. And just because they disclose this (which the SEC requires) does not make it better. However, the worst offenders are those not paid in cash but in free trading shares. Some of these operators will be dumping hundreds of thousands of shares (while you are buying). Kind of makes it hard for the price to rise, doesn't it? At bottom, there are several things for an investor in penny stocks to watch out for: high volume, strange financing deals, outrageous claims by the company. High Volume: This is a primary red-flag for micro-cap stocks. A tiny company that trades more than a $100,000 in (dollar) volume on an average daily basis should be reason for alarm. Most tiny companies with high volume (dollar volume in particular) have a huge amount of shares outstanding and/or are being promoted (usually by dubious individuals). Wicked Financing: Small companies have a hard time getting big cash injections. One way they get cash is by making complex deals with accredited investors. Some of these deals include warrants, preferred stock, and debentures, set up in ways that could cause a serious amount of dilution. Of course not all deals are bad for the company or for the other shareholders. It really depends on the particulars. Just read through the company filings and you will know when things just don't add up. A New Breakthrough: When a micro-cap company comes out with a press release which makes a claim (such as a cure for cancer, etc.) be more than a bit skeptical. Outrageous claims are almost always fiction. The best research is reading the corporate filings. Find them right at the SEC site. The market has now ripped the face off the shorts with about the same force as the last correction in October. We are now 13% higher than the lows just a little over a month ago. I figured the shorts would get punished again but I was only expecting a run to about the 200 day SMA or about 2025 on the S&P at the most. I entered heavy short just after the FOMC meeting (I had some small option positions from just above 2000 previous). Most traders who were bearish just a few weeks ago are now all out bulls again. From a contrarian sentiment indicator I would say that is good for the short crowd. But the Fed did cave and basically said they will never raise interest rates again, so you could see how the logic could propel those bears (now bulls). The dollar has been crushed - which is good for commodities - which is good for stocks. But the overall picture has not changed as stocks are overvalued and the world economy is in the can (exactly the reason every central banker is pulling every trick out of their hat). I do have the voice in my head that is saying something about not fighting the fed (again) and that voice does need to be respected. So I will tread lightly here.
The market has broke just above 2000 now on the S&P and there is some technical resistance at this level. However, the market probably pops even higher here to burn some more shorts - maybe taking us all the way to the 200 day moving avg. So I am just entering some small option positions here and will add as we most likely break higher.
During the 2008 collapse there were at least 6 bounces of 8% or more on the way to 666 on the S&P, which turned out to be the ultimate bottom and bounce. The sell-off started slowly and thus the bounces tended to the mild side, and when the crashes ultimately occured during the later phase, the bounces and rallies were ultimately stronger. The bounces ranged from 8% at first to 27% before the ultimate bottom. The year 2000 collapse started somewhat more forceful and the bounces tended to be somewhat even all the way to the bottom. The 2015/16 correction has started even more tumultuously than either those two bear markets. The first bounce off the August/October low was nearly 13%, which ripped the faces off many on the short side, creating the most pain. We are now probably on the start of a new bounce. There are two reasons (aside from obvious over-sold conditions on the technicals) that we could see a rally here. First, is that the central bankers of the world are once again active. The FED itself wll be having their meeting this week. We all now know what the normal market reaction is to the FED meeting schedule - See Story Here. The second, is the fact that the corporate buy-backs can once again kick into high gear once earnings season winds down. The wild card? Oil of course. Energy (and basically the fear that there will be massive credit defaults) has been the tail wagging the market dog. I will probably play the big picture by adding into market shorts as the S&P rises from this correction. Starting small and averaging in. The new mantra is to sell the rally - not buy the dip. We shall see.
|
Paul SaadSenior Manager, Paul Saad and Associates, LLC Archives
May 2020
Categories |